A seismic “CT scan” of the North American lithosphere reveals regions of melted rock

New model illuminates rock composition variations under the U.S., providing insight into evolution of continents and locations of natural earthquake and volcanic hazards.
Penetrating wave technologies, like sonar or an MRI, have revolutionized all areas of science, allowing for 3D renderings of subsurface objects, such as the detection of a submarine in the ocean or cancer within the body. How different wave types (and their speeds and frequencies) scatter, reflect, change speed or lose energy within a substance conveys information about the size, distribution and chemical composition of any objects within it – information that can be used to understand how the material has changed over time.
Now, scientists are looking at composition and evolution of whole continents, like the North American lithosphere For decades, seismologists have measured seismic waves from earthquakes, that pass through the earth, as a way to reveal different structures in the Earth’s crust and upper mantle. Recent innovations in imaging techniques and high-quality seismic datasets have improved researchers’ ability to image the lithosphere in 3D, and from these images, pull out distinguishing geologic structures, compositions and processes.
“You try to make sense of the geology and very often that’s done as kind of a superficial, qualitative afterthought,” said Rob van der Hilst, MIT Schlumberger Professor of Earth and Planetary Sciences and EAPS Department Head, at the thesis defense of Eva Golos PhD ‘20. “And I really challenged Eva to go a little bit further and say, well, it would be really good to have more quantitative integration of the geology and the petrology and the tomography.”
Now, a new seismic wavespeed model from researchers in the MIT Department of Earth, Atmospheric and Planetary Sciences (EAPS) is on its way to doing that—providing “CT scan” like cross-sections of the earth under the continental U.S. and southern Canada down to about 100 kilometers. They found that areas with similar seismic signals, particularly elastic properties of rock, corresponded well with known tectonically-active provinces. Further, they’ve developed a way to detect rock that is currently or previously melted. Knowing where and how big these porous pockets of melted rock are could help identify volcanic and earthquake hazards, and determine how deep the lithosphere is around the U.S., which is important for regions that undergo a lot of tectonic activity. Additionally, the process of rock melting causes changes in nearby mineral systems, so it provides clues to the chemical composition of nearby rocks. Each of these hints helps to paint a picture of the geologic history of the mantle below North America and how continents assemble.
Golos, van der Hilst, and former EAPS postdoc Hongjian Fang published their findings in the Journal of Geophysical Research.
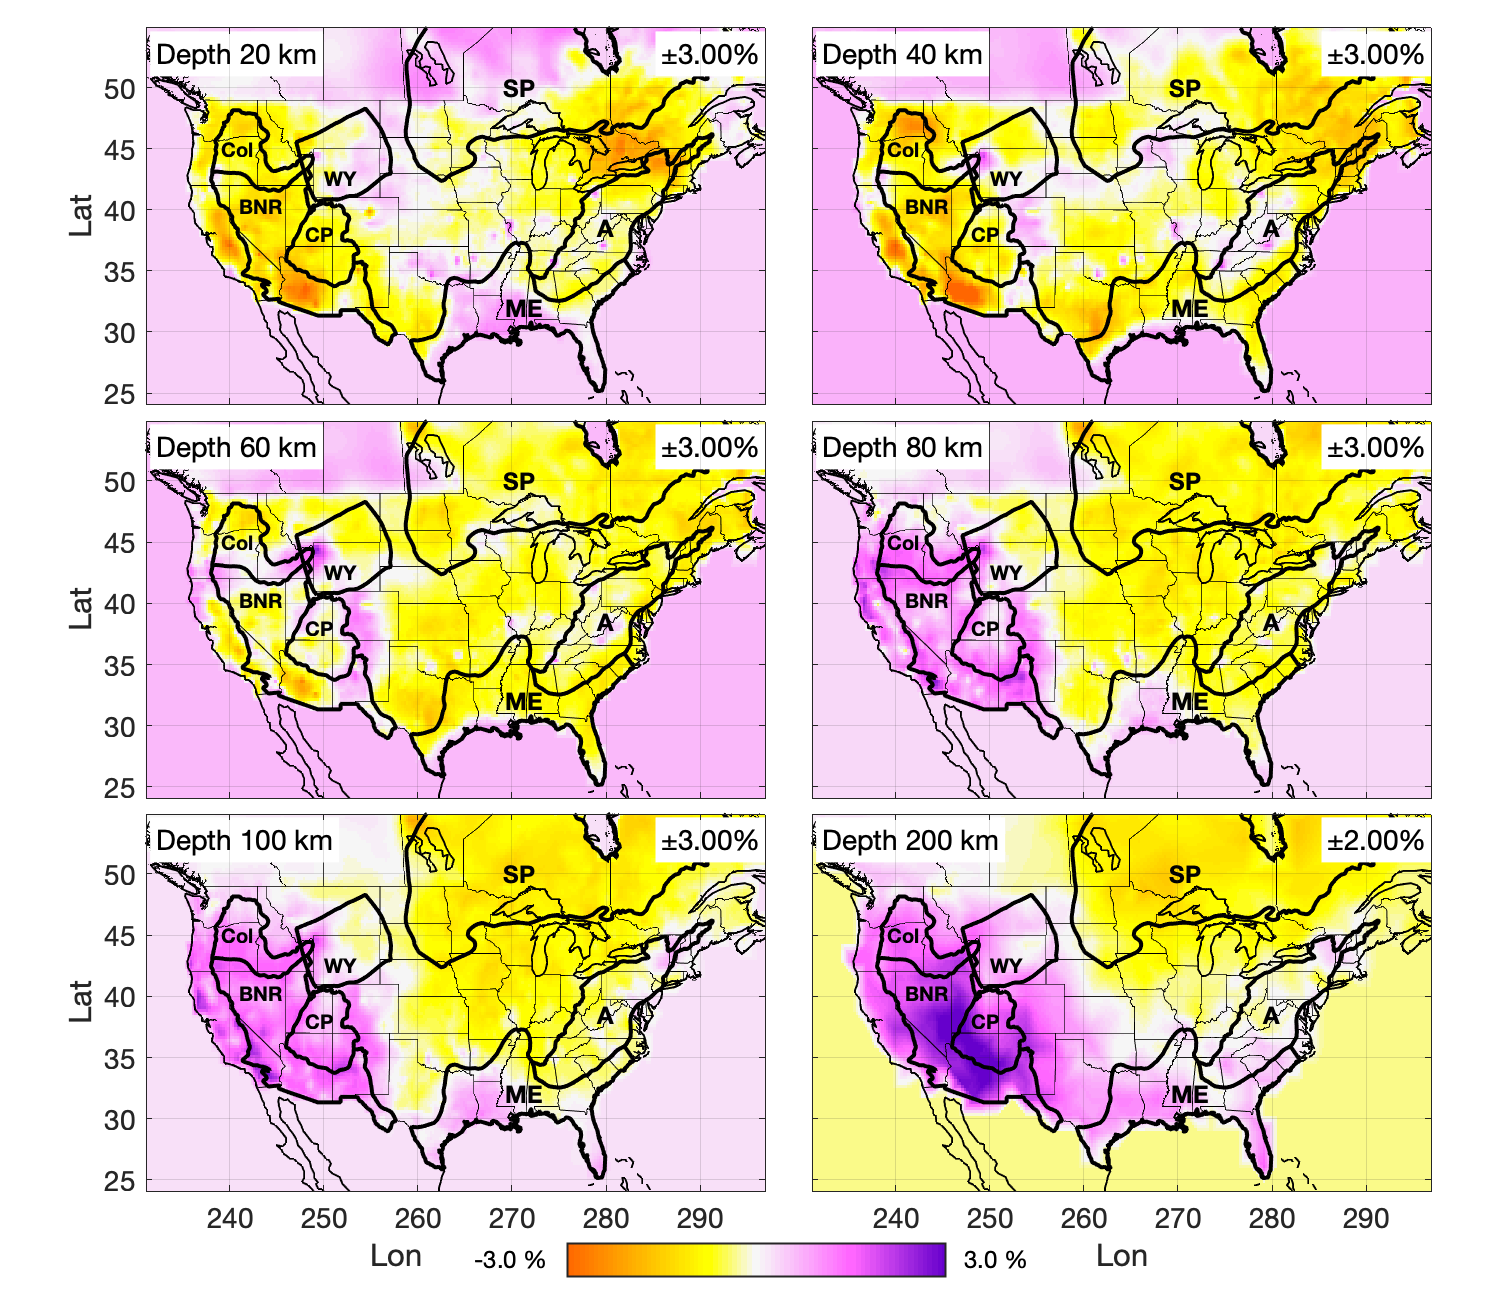
Horizontal slices through a Vp/Vs model, purple areas indicate more positive values. Credit: Golos et al. (2020)
Cold, fast East vs hot, slow West
North America is very well imaged, says Golos, with dense coverage by seismometers that record surface waves (for instance, Rayleigh waves) that are responsible for the strong shaking during earthquakes, and body waves i.e. primary (P) or secondary (S) waves that travel through the earth, in a compression or shearing motion, respectively. Most large-scale earth imaging techniques map speed variations in one type of seismic body wave. Geologists generally accept that the speed at which P or S waves travel is most sensitive to rock temperature: waves move faster through older, cold rock than newer, warm areas of the crust and upper mantle. Here, large-scale features emerge: the Northern and Eastern U.S. and parts of Southern Canada have thick lithospheres that make up some of the oldest part of the continent, while surrounding areas are younger. Some locations in the West, such as the tectonically-active Yellowstone region, have very shallow lithospheres and younger, hotter rocks.
“But in truth, we know that wavespeed is dependent on a whole host of other things, including rock composition, as well as temperature, and features like discontinuities within or at the base of the lithosphere,” says Golos. Important pieces of the geologic picture that could be missed are, “processes like partial melt that can very strongly effect wavespeed in a way that is really hard to piece out if you’re only resolving one parameter.”
To look at the rock elasticity in the lithosphere in 3D, the geophysicists calculated the ratio of P to S wavespeeds (Vp/Vs), incorporating information from body waves as well as Rayleigh waves, which are sensitive to depth. This ratio, Vp/Vs, also varies due to which minerals are present, since some are more stable at certain temperatures and pressures than others. For example, olivine, the most prevalent mineral in the lithospheric mantle, can exist with either iron or magnesium in its structure, which is reflected in its seismic properties. If melting has occurred in a location, volatile compounds and iron will be preferentially extracted and move up in the lithosphere. Evidence such as this provides insight into the history of the mantle.
Finding melt
With profiles of Vp, Vs and Vp/Vs variations (from an average value) across the continental U.S. in horizontal slices every 20 km, the researchers compared them to known geologic provinces, such as the west’s Columbia Plateau, the Colorado Plateau, Wyoming Province, and Basin and Range. In the north and east, they similarly investigated the Superior Province, Appalachian Mountains, and Mississippi Embayment.
They saw that Vp/Vs varied about 3% over the continent and did indeed capture other rock characteristics that Vp and Vs couldn’t, particularly in the top 60 km of crust. “We see that there’s a strong correlation between the wavespeed throughout the lithosphere and features in geology that we would recognize. For example, the very old parts of the lithosphere in the Northern U.S. and in Canada appear distinct from the areas that are nearby, but maybe slightly younger,” says Golos. Some areas, like the Basin and Range and Mississippi Embayment, corresponded well to known geological regions. The researchers were also able to image the difference between the lithosphere and the athenosphere, a subducting slab in the Western US, and the Midcontinent Rift near the Great Lakes, which helps to verify their understanding of plate tectonics, Golos says.
To determine if these provinces extended deeper into the earth, the team grouped the data based on similar wavespeed characteristics only, without any other known geological information. This blind clustering method revealed 9 areas that seemed to share geologic history with distinct differences between the eastern and western U.S. Additionally, regions emerged with particularly high values of Vp and Vp/Vs; “…we see differences between, for example, the Basin and Range in the Western U.S., and the Yellowstone hotspot, which is nearby,” says Golos. “But it [the hotspot] seems to have very high Vp/Vs ratios, and that gives us clues about where melt might or might not exist within the lithosphere.

Regions clustered by wavespeed values, indicated in colors, with an overlay of known tectonic provinces. Credit: Golos et al. (2020)
Three vertical cross-sections with particularly high Vp/Vs ratios investigated this further: across the northwest, southwest, and northeast. One way to get this value is with low Vp and very low Vs, which Golos says is attributed to partial melting of rocks. A couple locations jumped out: beneath the Yellowstone hotspot and around the periphery of the Colorado Plateau. Both where active or recent volcanism has occurred, which is consistent with the presence of large scale partial melt. In New England, they did not seem to find partial melt, but instead thinning of the lithosphere and warmer rock upwelling from below. While the researchers can demonstrate and confirm that this method can locate areas with partial melt, they are not yet able to quantify the amount, geometry or distribution of the rock, and their images are limited to the top 100 km of the Earth.
However, locating areas of partial melt are critical for our understanding of the Earth, in particular its elasticity. “The role of melt in and at the base of the lithosphere, it seems to be very important, because this is where our elastic understanding of the Earth really is going to fail,” says Golos, noting that most earth models require elasticity. A lithosphere with widespread melt in or directly below it would behave and deform differently, with significant implications for earthquake and volcanic hazards, so the ability to infer its presence and distribution is valuable.
“This method is really exciting to me because eventually we can use it almost as a thermometer and chemical probe to say on large scales: do we have temperature variations? Do we have iron depletion or these other mineral processes happening within the lithosphere?” says Golos, who is looking at this now.
Story Image: Continential United States (Credit: NESDIS NOAA)